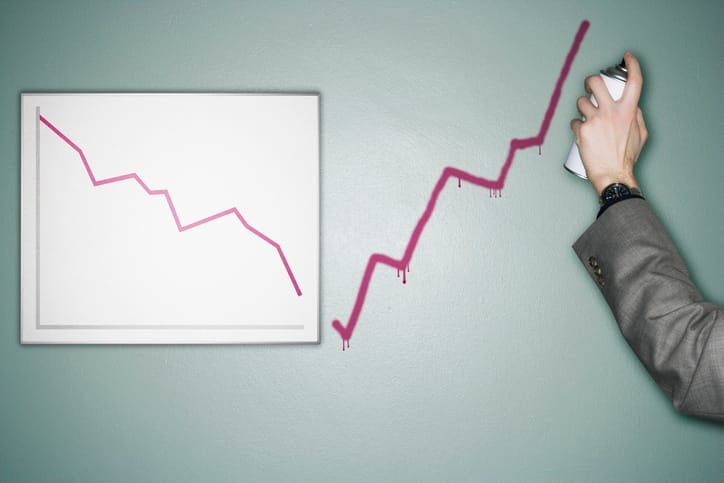
PP/ PCDI: Fund Manager Follies
Using Cash Positions As A Contrarian Indicator
Extreme Valuations Point To Sky-High Risk
Henry Neuwirth’s final helicopter flight lasted just two minutes.
Amateur pilot Neuwirth had barely taken off from his helipad in Middletown, New Jersey, and headed on a joy ride over the East River when he – and his machine – exploded into a ball of flame.
It was July 28, 1973, and Neuwirth was just 40 years old.
Nine years later, in nearby Manhattan, death came knocking for Frederic Mates.
Perhaps inspired by his own last name, Mates had moved to New York City during his midlife crisis and opened a singles bar. After eight years of shimmying through the disco scene, he dropped dead of a heart attack at age 50.
The Grim Reaper took a few more decades to reach David Ehlers, who’d spent the late 1980s managing a Blockbuster Video franchise in the U.S. island territory of Guam. Afterward, he settled in Las Vegas as a “gambling investment advisor,” which meant he sent spies to casinos to see which gaming machines got the most use, and then recommended those stocks to his subscribers.
In 2021, at age 89, Ehlers finally cashed out for good after breaking his hip.
On the surface, these three men don’t seem to have much in common — just slightly offbeat lives that took an unusual trajectory.
But they were all bound together by a single mistake they made in the early 1970s… one bad decision that, in hindsight, almost seems like a curse…
Before Neuwirth, Mates, and Ehlers met their strange ends, they each managed one of the top-performing mutual funds of the late 1960s, fueled by “unstoppable” growth stocks like Polaroid, Xerox, and IBM. The Mates Investment Fund was the top performer of 1968, turning in a net asset value gain of 153%. Helicopter pilot Henry Neuwirth’s Neuwirth Fund was the second-highest flier at a 91% gain, and Ehlers’ Gibraltar Growth Fund came in third at 73%.
No one talks about these old funds today. You have to dig through deeply buried newspaper archives to find any mention of their names. It takes even more research to uncover the odd fates that befell their managers after the “go-go” market cratered in January 1973 and wiped out nearly all the gains these funds had notched for their trusting investors.
Unfortunately for these hot-shot managers, they (and many others, including more well-known names like Fred Carr and Gerry Tsai) all made the same error. They were overinvested, with very little spare cash on hand.
In 1972 – the year before the crash – average mutual fund cash levels shrank to then-record lows of just 4.2% cash invested, reflecting an extremely high level of manager confidence (10% or more of assets held in reserve historically meant fund managers were in a bearish mood).
Managers in 1972 were ultra-bullish. And then came the big drop.
Between January 1973 and December 1974 – triggered by President Richard Nixon’s dollar devaluation and the 1973 oil crisis – the Dow Jones Industrial Average dropped 45% in its seventh-worst bear market in history. It was the worst loss since the mass carnage of the Great Depression.
In 1972, Mates dropped to 456th place in the mutual-fund performance derby as his fund lost 8.76% of asset value, Neuwirth’s fell to 477th place, and Ehlers’ shuttered completely after its assets under management dropped from $100 million to $20 million.
Ultimately, all three of the funds quietly closed up shop or were absorbed into bigger concerns. Today, if you search online for them, you’ll find that records have been all but scrubbed from the internet.
As for the three erstwhile star managers, they all ended up as far-flung exiles (in Neuwirth’s case, flung far from the wreckage of his whirly bird)…
What’s remarkable – or scary – is that large fund managers have a history of being wrong about exactly this scenario… over and over again.
In both directions, no less.
When fund managers are overinvested and overconfident, with very little cash on hand, watch for a downturn shortly. When they’re overly bearish, you can expect a bull market on the way. In 1951, for instance, managers panicked and set aside a record 15% of cash – and stock gains spent the next decade growing at a breakneck pace of 16.4% annually.
In 1998, by contrast, cash levels dipped down to 4.8%, their lowest point since the 1972 debacle. Managers clearly expected a continued boost in stocks. What happened next? The dot-com crash.
Why are fund managers consistently wrong about the direction of the markets? It’s likely a combination of factors… Like all investors, managers can fall victim to any number of cognitive biases that can lead them astray. But herd mentality is particularly common. There’s a perverse incentive in institutional investing where there’s far less career risk in going along with the crowd – regardless of the outcome – than in taking a divergent position.
In any case, mutual fund cash levels have historically been one of the best measures of long-term investor sentiment and a reliable contrarian indicator… one that’s still well worth tracking today.
And right now, asset managers are holding their lowest levels of cash in history – at just 1.4% of total assets.
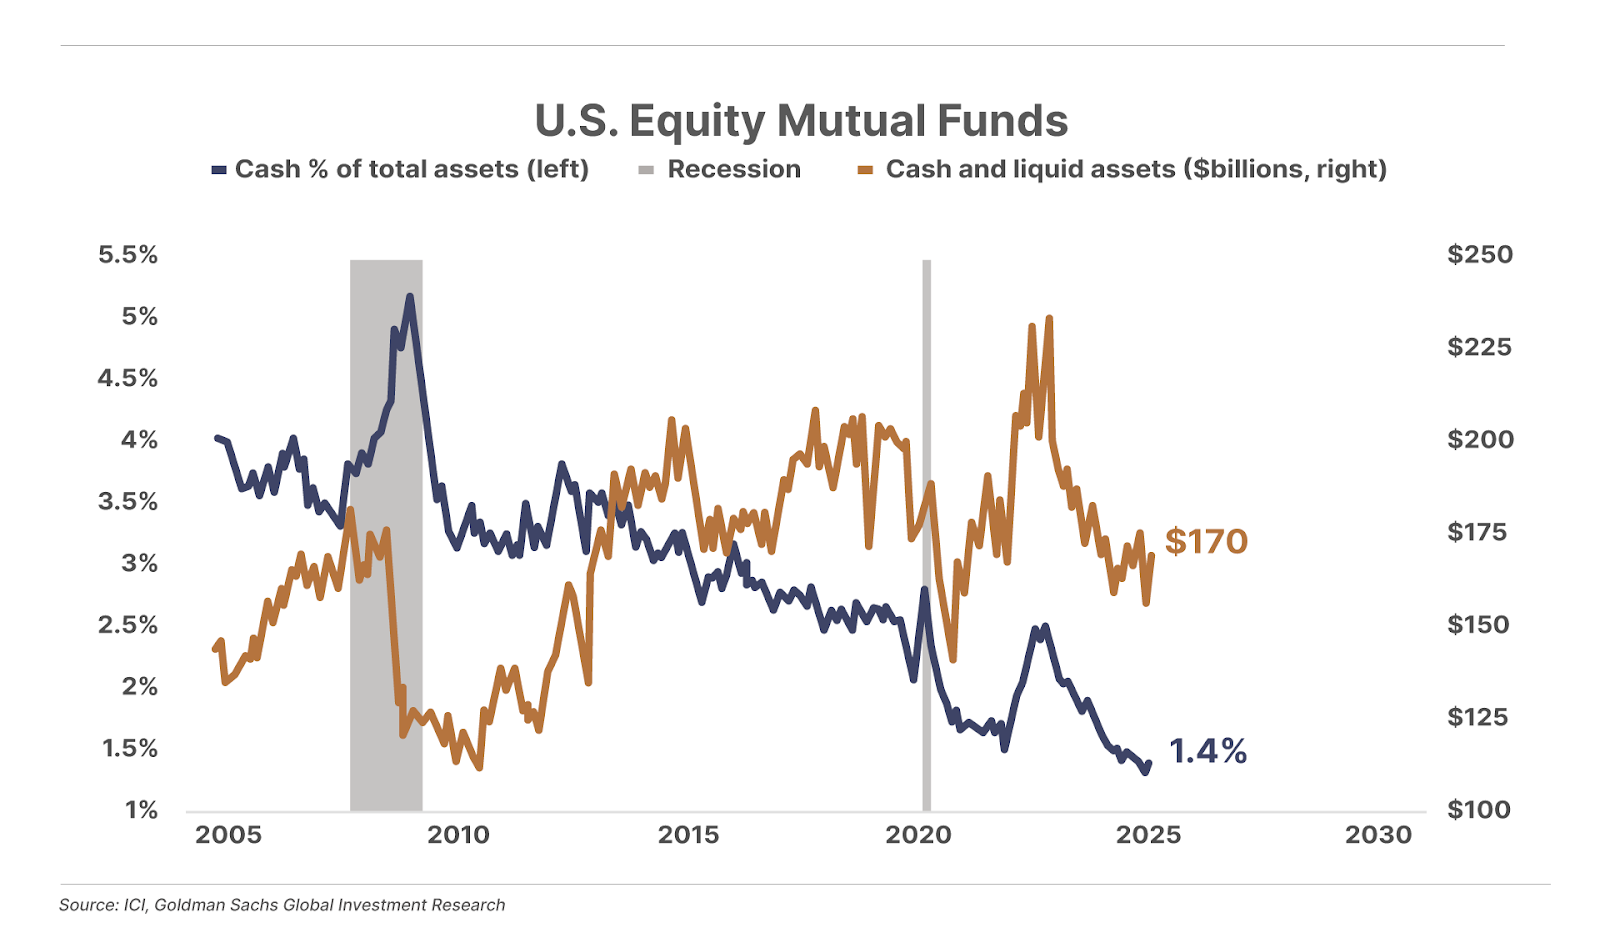
In other words, institutional money managers as a group have never been more convinced that stocks will continue to go higher.
U.S. households are also holding a record 44% of their wealth in stocks, suggesting retail investors similarly see nothing but “blue skies” for the market ahead.
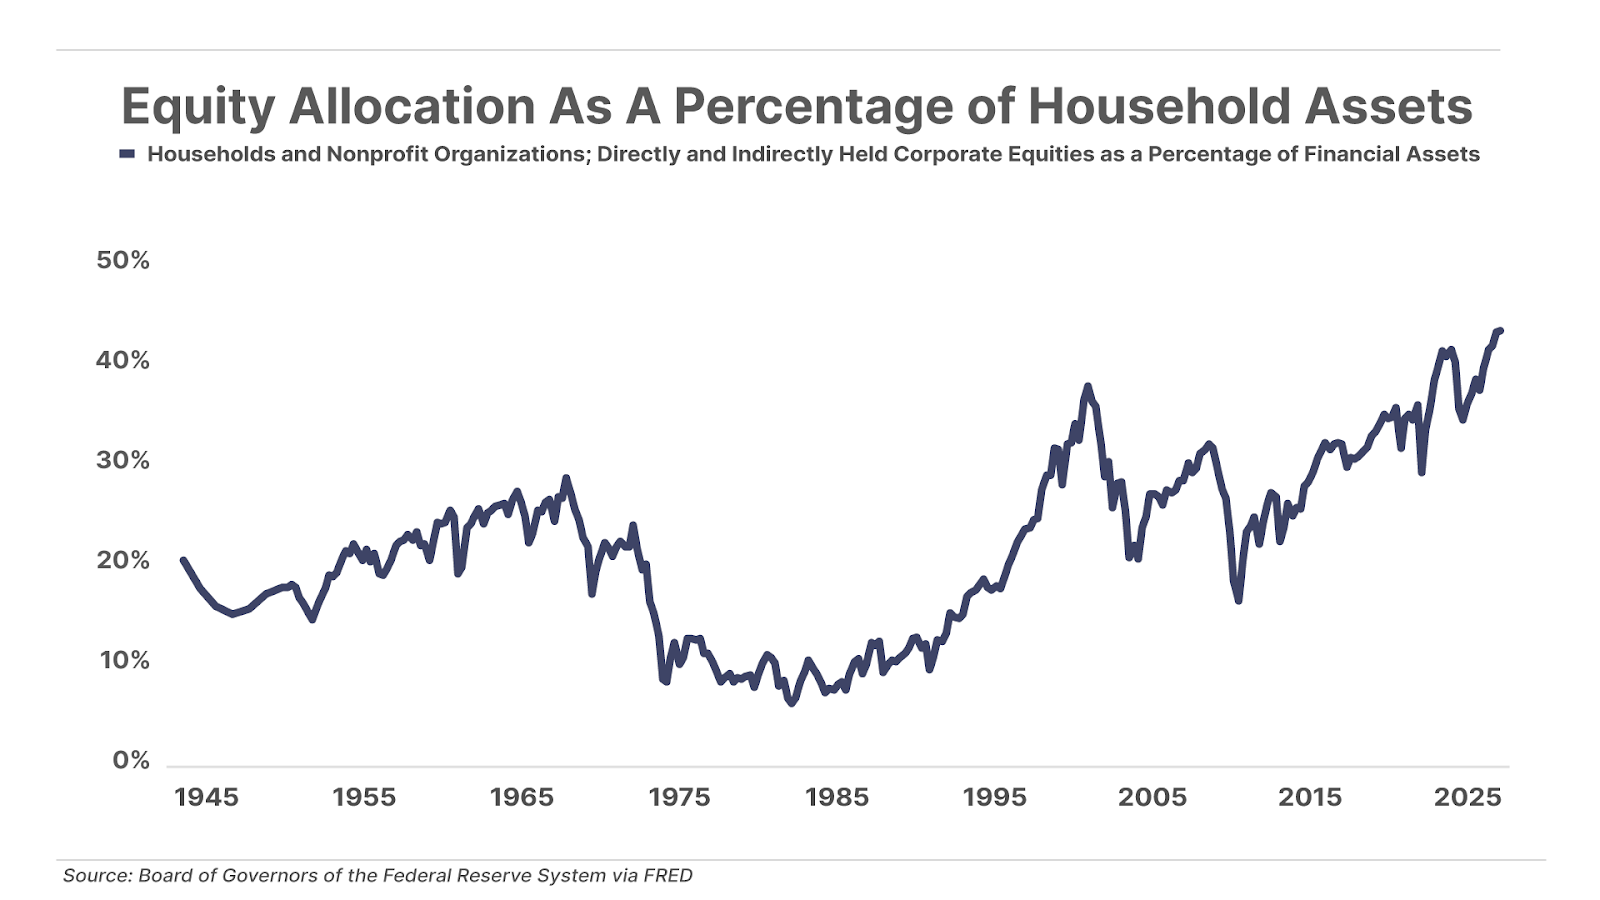
Which means we should be expecting the opposite.
But that’s not the only worrisome extreme that we’re seeing…
U.S. Markets Are Wildly Overvalued
You’ve likely heard that the broad market is expensive right now. But you may not appreciate just how extreme several key valuation metrics have become.
For example, the Buffett Indicator – Warren Buffett’s favorite valuation metric, which compares the market cap of the broad Wilshire 5000 index to U.S. gross domestic product (“GDP”) – now sits at just under 200%.
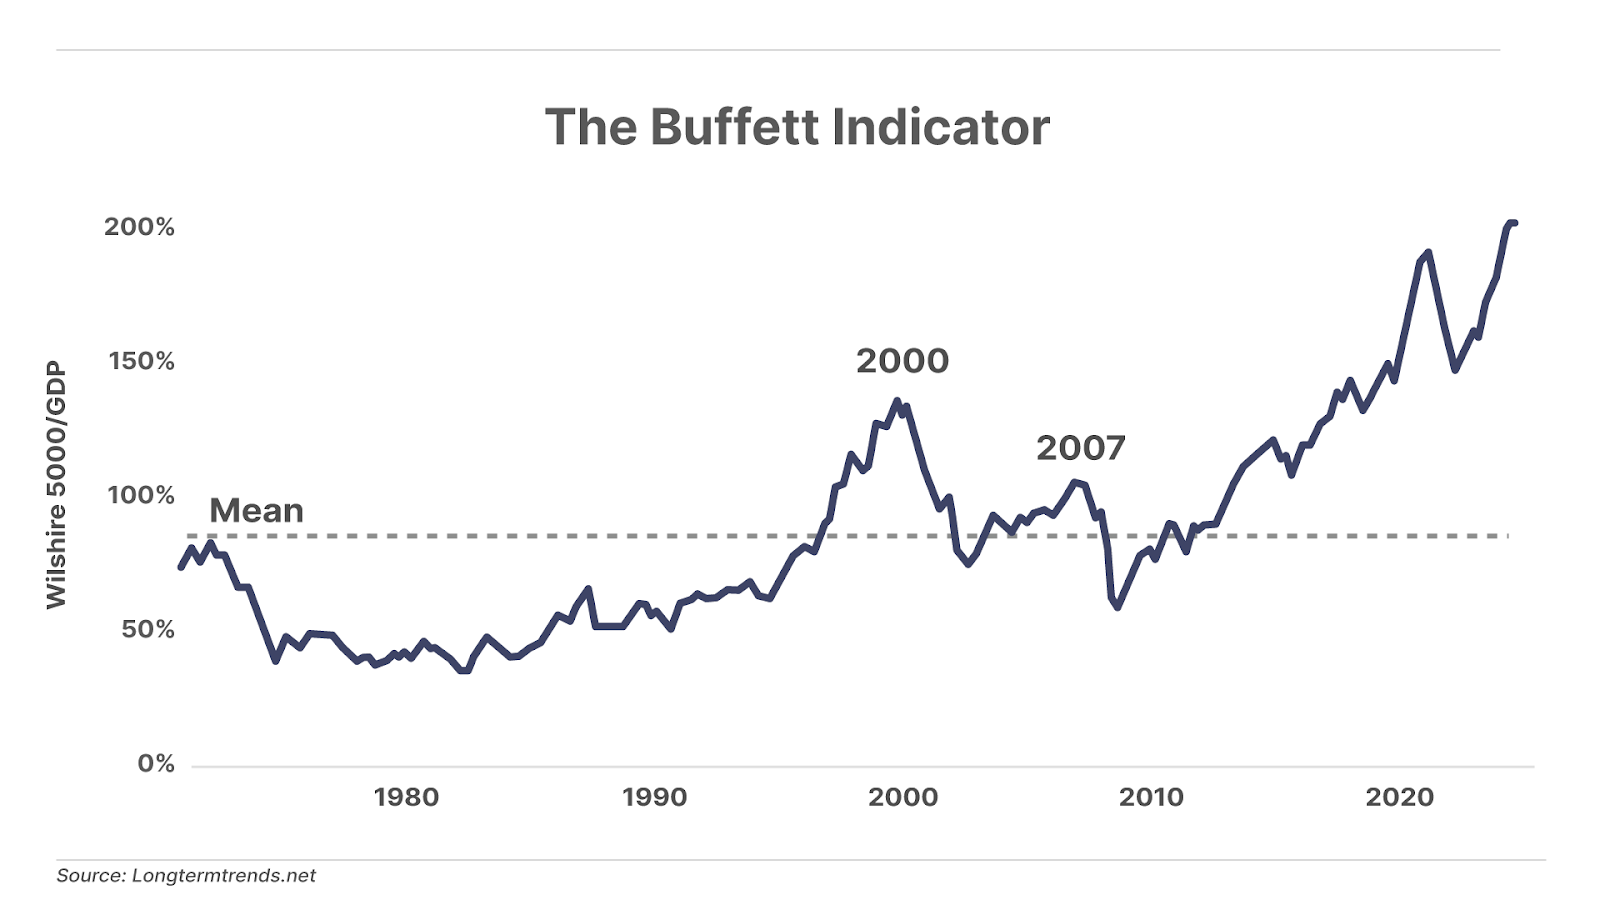
Said differently, the U.S. stock market currently trades at two times the total value of all the goods and services produced in the U.S. each year.
This is the highest level in the history of the indicator, dating back to 1974 – the year the Wilshire 5000 was launched – and is roughly 40% higher than the previous record set at the peak of the dot-com bubble in 2000.
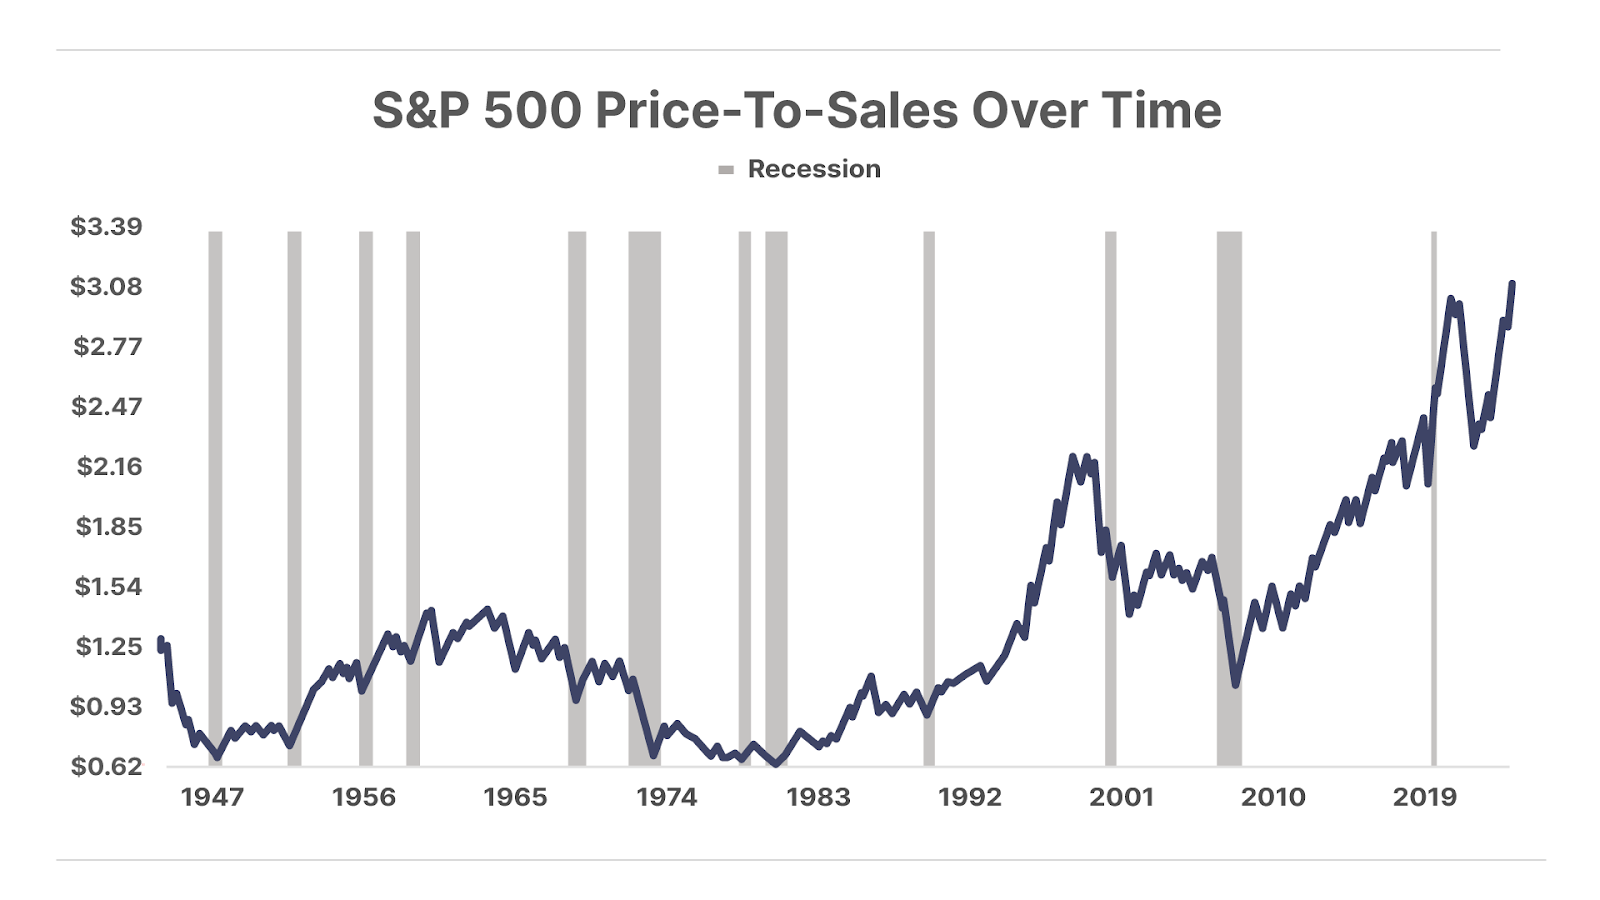
The S&P 500’s price-to-sales ratio is similarly stretched. It’s currently trading above 3 for the first time in history – which is also roughly 40% higher than its previous extreme in early 2000.
Stocks are also trading at historic extremes relative to earnings. The S&P 500’s cyclically adjusted price-to-earnings (“CAPE”) ratio – which uses the market’s average inflation-adjusted earnings over the prior 10 years to smooth out short-term earnings “noise” – is currently around 35.
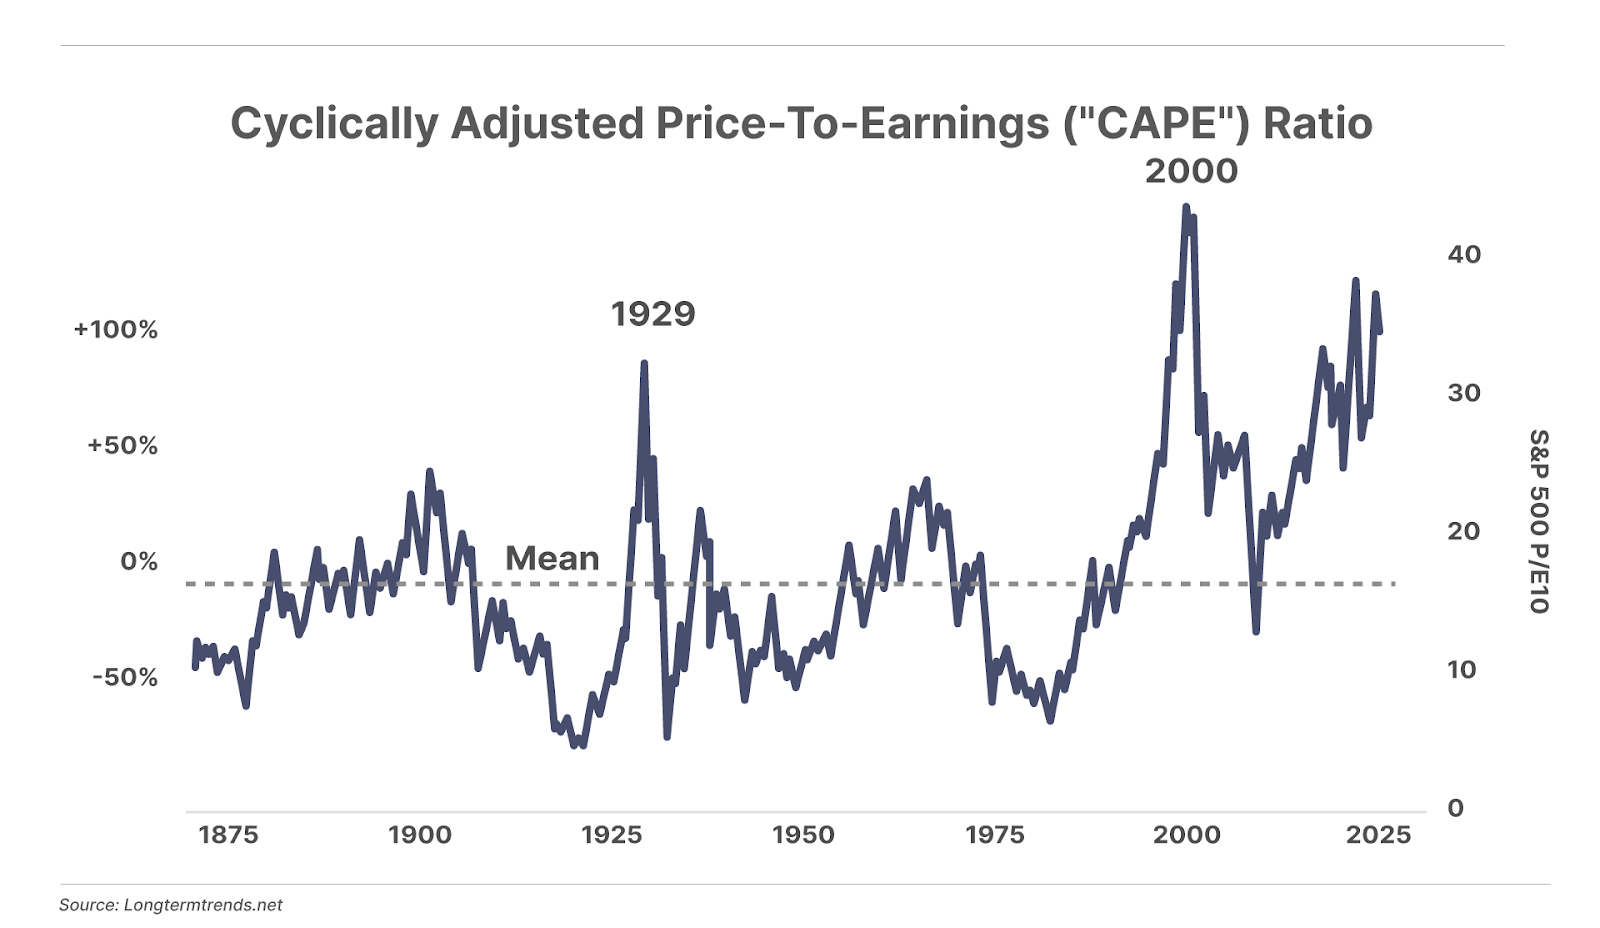
While this is shy of the all-time record set in 2000, it’s still well above prior bubble extremes in both 1929 and 1965, and more than double the long-term mean dating back to 1865.
Most notably, combining these broad-market measures, along with a handful of others – including traditional trailing and forward price-to-earnings (“P/E”) ratios, price-to-book (“P/B”), enterprise value-to-earnings before interest, taxes, depreciation, and amortization (“EV/EBITDA”), and the Q ratio, which compares a company’s market value to the replacement cost of its assets – produces a valuation in excess of all prior extremes in history.
Stocks Have a Long Way To Fall In A Real Bear Market
While sentiment and valuation extremes like these are reliable contrarian signals – signaling a directional change to come in the market – they are not precise timing indicators. Change could come at any time… and these extremes can sometimes persist for years before they finally “matter.”
However, we are confident that sooner or later, they will matter – just as they always have in the past – and both sentiment and valuations will reset much lower.
So, how far could stocks fall? It’s impossible to know for certain, but we can make some educated guesses.
As you can see in the chart of the CAPE ratio above (currently at 35), since 2000, major market selloffs have seen this ratio bottom somewhere between 15 and 25, around one to three years after the peak on average.
Assuming earnings remained static, a CAPE of 25 – similar to where stocks bottomed during the COVID-19 crash – would put the S&P 500 at 4,100, or about 30% below its current level of 5,700.
At the lower end of the range, with a CAPE of 15 – roughly where stocks bottomed during the Global Financial Crisis – the S&P would trade below 2,500, a decline of nearly 60% from current levels.
Of course, we would also expect earnings to slow during a major market decline, which would bring the 10-year average of inflation-adjusted earnings down as well. In that case, stocks would need to fall more than the above estimates to account for that.
We suspect not many of today’s exuberant investors are prepared to weather a 30% to 60% drop over the next few years… and unfortunately, it’s possible that could be an optimistic view.
Why? Take another look at the CAPE ratio above. You’ll notice that prior to the “easy money” (low-interest-rate) era of the past few decades, major market declines tended to bottom at significantly lower valuations than they have recently. In fact, prior to the 1990s, it was rare to see the market bottom at a CAPE above 10.
For example, at the end of the inflationary bear market of the 1970s, the S&P 500’s CAPE ratio fell to 7. A similar valuation today would bring the S&P 500 to 1,140, a decline of 80% from current prices.
At the 1932 Great Depression low in stocks, the market traded at a CAPE of just 5.5. That would put the S&P 500 at 895, a decline of nearly 85%.
Even worse, investors had to wait up to 25 years for stocks to return to new highs after these declines. By the time they were over, many investors had sworn off investing in stocks ever again.
Now, we’re not predicting this kind of worst-case scenario will happen. Fact is, the federal government (or Federal Reserve) has intervened in every major market decline since the 1990s. And we don’t expect that to change.
But we also believe that most equity investors are greatly underestimating the potential range of outcomes that are possible in the years ahead.
Hope For The Best, Prepare For The Worst
Again, we can’t know for certain when these extremes will “matter,” only that they eventually will. And when they do, investors who are heavily invested in overpriced equities could be wiped out.
If you hope to avoid that fate – and be among the relative few who are able to take advantage of the generational buying opportunities that are likely to arise – you must prepare now.
This is why we continue to recommend that Porter & Co. readers remain extremely conservative today.
Stay patient. Be sure to hold plenty of cash. And keep the bulk of your equity portfolio in the highest-quality companies trading at reasonable prices… or better yet, consider investing in an asset – like distressed bonds – that can generate equity-like returns with far less risk.
Porter & Co.
Stevenson, MD
New to The Big Secret Portfolio? Start With Our Top 3 “Best Buys” Today
Our goal at Porter & Co. is to bring you world-class investment research, focused on “inevitable” businesses that you can buy and hold forever. This is the surest and safest path to building permanent wealth.
While we don’t believe in timing the market, we do keep a constant eye out for bargains. In each edition of The Big Secret, we highlight three current portfolio picks that are at an attractive buy point. We suggest you focus on these:
1. Nike (NYSE: NKE) is the world’s largest athletic apparel and shoe maker. The company rose to prominence by creating one of the most beloved global brands, and has grown revenue in 22 of the last 25 years. A series of operational and strategic missteps has put Nike on track to post a rare decline in sales in 2025. However, company veteran Elliot Hill has stepped in as CEO to turn the business around. We believe Hill has laid out a credible plan for Nike to recover toward new record highs in revenue by 2028, and also return the company to its historic profit margins. In this scenario, Nike should generate more than $6 in earnings per share by 2028, driving its share price toward $200, from around $72 where it currently trades. We recommend buying shares of Nike up to $100.
2. The Hershey Company (NYSE: HSY) is the owner of the iconic 130-year old chocolate brand consumed by millions of Americans each year. Hershey is the ultimate forever stock, with a long history of navigating every economic environment or market shock. Hershey is currently on track for its sharpest earnings decline in over two decades due to a severe cocoa shortage that has driven prices up to record highs, resulting in reduced margins for the company. But with global cocoa supplies on track to normalize this year, we expect the company will recover to new all-time highs in revenue and profits in the years ahead. With shares trading at just 17x last year’s earnings, Hershey is near its cheapest valuation of the last decade – a compelling bargain for one of the world’s greatest brands and the ultimate “forever stock.” Currently trading at $164 per share, it is well below our recommended “buy up to ” price of $200.
3. Uber Technologies (NYSE: UBER) is the world’s largest mobility platform, completing over 30 million ride-hailing trips and deliveries each day. After years of losing billions of dollars building a network of over 160 million consumers and 8 million drivers, Uber has now achieved sufficient scale to produce mountains of free cash flow. The business generated $6 billion in free cash flow in 2024, nearly double the $3.3 billion it produced in 2023. Uber is projected to reach $8 billion in free cash flow this year, and to continue growing at a double-digit pace over the coming years. At a $148 billion market capitalization, the business trades cheap at just 21x free cash flow, or a nearly 40% discount to the S&P 500. Currently trading at $74 per share, it is still below our recommended “buy up to” price of $100.
Click here to access The Big Secret portfolio.